Brightness and color are different measurements
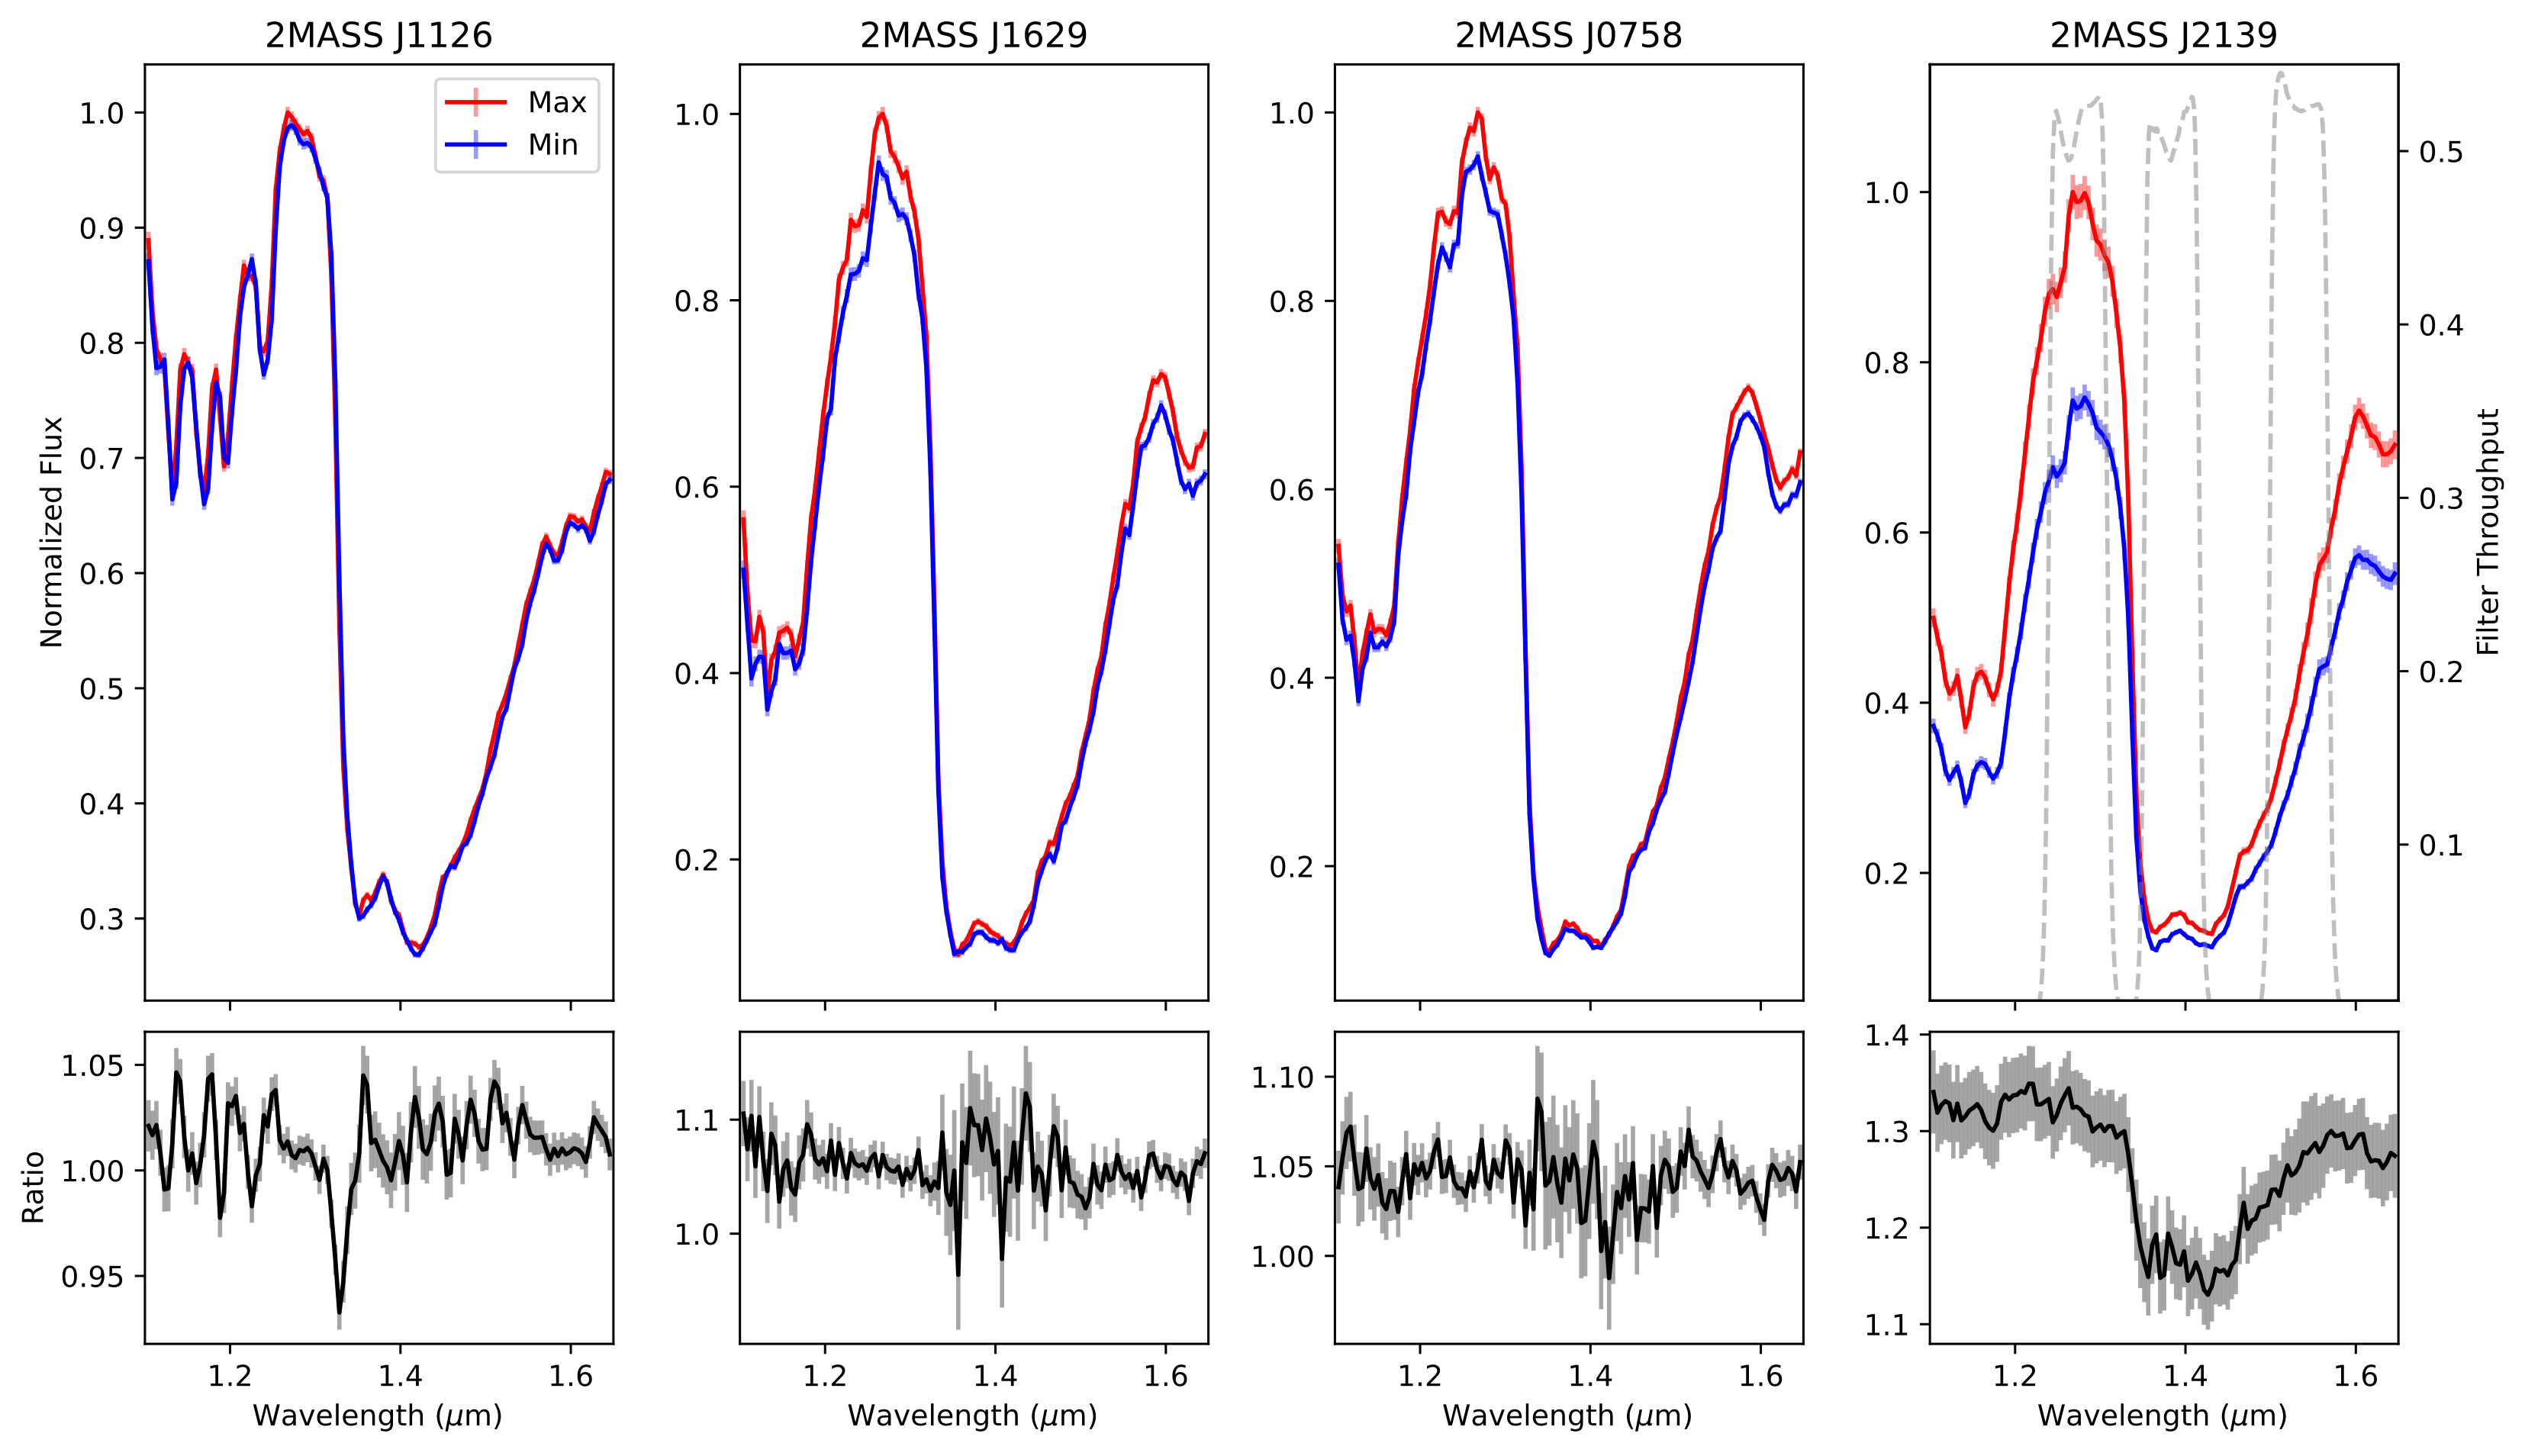
Madalyn Chapleski led our Hubble study of three variable brown dwarfs. We compared their changing spectra with the well-studied object 2MASS J2139. The new targets do not show the same strong reduction in variability inside the 1.4-micron water absorption band.
An object can brighten without changing its color appreciably. If the same fractional change occurs at every measured wavelength, astronomers call the variability gray. The word describes a relationship between measurements, not the visible color of the object. This distinction makes a spectrum taken repeatedly more informative than a single broad-band light curve.
Why the water band matters
Molecular absorption affects where light escapes from an atmosphere. Within a strong absorption band, we generally see higher layers than at nearby wavelengths where the gas is more transparent. Comparing changes inside and outside the band can therefore constrain how atmospheric structure varies with depth.
A cloud pattern that changes the light from deeper layers need not affect an absorption band by the same amount. Conversely, similar changes across the band motivate models that affect a wider range of atmospheric layers. Neither pattern alone identifies a unique cloud altitude or temperature structure.
Comparing several atmospheres
The study combines time-series spectra with models that mix atmospheric regions of different temperatures and cloud properties. The observations support heterogeneous atmospheres, but the objects follow different brightness-color trends. A single explanation based only on patchy clouds does not capture every object’s behavior.
Comparing multiple objects tests which conclusions apply broadly. A successful model for one brown dwarf is a useful starting point, but it need not describe every atmosphere at a similar temperature. Differences between objects are part of the physical result, not simply scatter to remove.
What the observations leave open
The light curves of two targets are irregular enough that the study does not establish precise rotation periods for them. The spectral changes also permit more than one physical interpretation. High-altitude haze is a possible explanation for some of the gray variability, not a confirmed detection from these data alone.
Spectral variability is an indirect measurement of atmospheric structure. We observe the combined light from the visible hemisphere. Several combinations of temperature and opacity can produce similar changes in that combined light. A model must explain the time-averaged spectrum and the variability, while retaining those uncertainties.
Why this matters for planets
Brown dwarfs allow us to study changing atmospheres without a bright host star next to the target. The methods and physical questions also apply to directly imaged giant planets: how do clouds vary, which layers change together, and how stable are the patterns?
Broader wavelength coverage can compare several molecular bands with the surrounding spectrum. Longer time series can test whether a brightness-color relation repeats or evolves. Together, these measurements can distinguish explanations that remain difficult to separate in a single wavelength range.
The paper
Chapleski & Zhou (2026). Gray Spectral Variability in Three Brown Dwarfs Observed by HST/WFC3 Time-series Observations. The Astrophysical Journal.