A planet’s rotation in its changing light
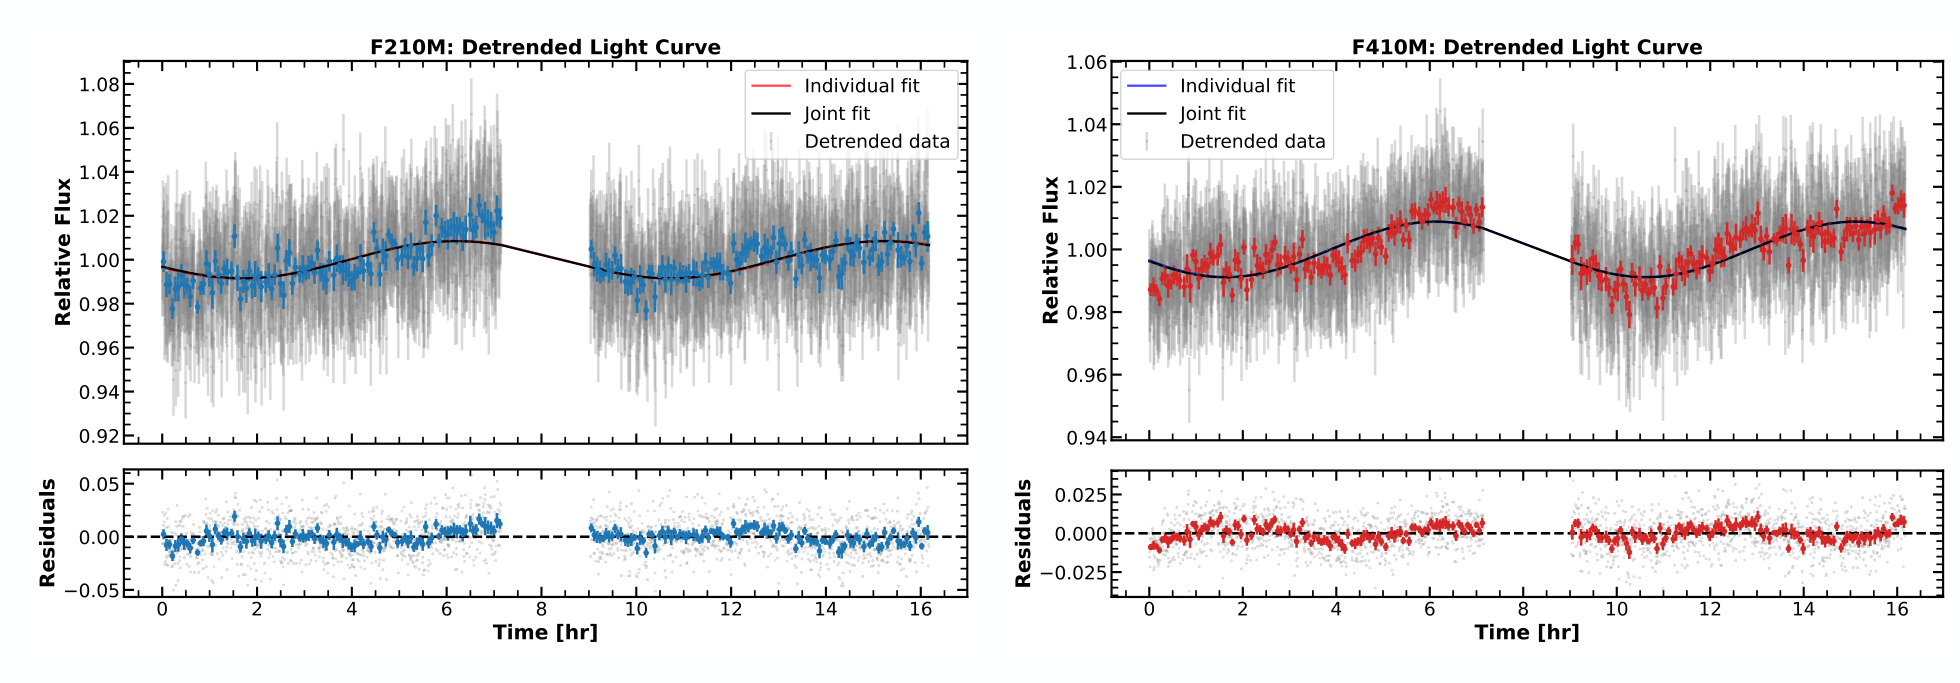
We measured a rotation period of 9.00 ± 0.13 hours for β Pictoris b. Our JWST observations followed the planet at two infrared wavelengths over a 16-hour baseline. Both light curves show the same repeating pattern. We interpret that pattern as atmospheric structures rotating into and out of view.
A rotation measurement does not require a resolved image of the atmosphere. A planet with brighter and darker regions can change in total brightness as it turns. The time between repeated features constrains the rotation period. The challenge is to measure those small changes beside a much brighter star.
Separating the planet from the star
We used NIRCam’s coronagraph to suppress the star’s light. The analysis then accounted for residual starlight, stellar variability, and instrumental changes. We tested the correction by injecting signals into comparison locations and checking whether we recovered them.
These tests address two different risks. A correction can remove real variability, or it can leave a pattern that resembles a planetary signal. Testing both constant and varying sources helps distinguish those failures. Agreement between independent wavelength channels provides an additional check.
What the period does and does not measure
The uncertainty of 0.13 hours is the formal error from a sinusoidal fit. Atmospheric evolution and a more complicated light-curve shape can increase the true uncertainty. Additional observing epochs are needed to test the period’s stability.
An atmosphere is not a fixed surface marking. Clouds can change while the planet rotates, and different atmospheric regions can contribute to the observed pattern. The distinction matters when interpreting a precise fit: a small statistical uncertainty does not establish that the assumed waveform describes every rotation.
How we view the spin axis
Combining the period with existing measurements of projected rotation speed and an estimated radius favors an equator-on view. The spin and orbital inclinations are consistent along our line of sight. The full three-dimensional obliquity remains unconstrained because the spin axis’s position angle on the sky is unknown.
The geometry explains this limitation. A period and radius give an equatorial speed. Spectral line broadening measures only the part of that speed projected along our line of sight. Comparing them constrains inclination, but it cannot determine every direction in three dimensions. The result informs the planet’s formation history without uniquely reconstructing it.
From an image to a time series
Repeated direct images can measure more than a planet’s average brightness. They connect atmospheric structure with rotation and, when combined with other measurements, spin geometry. This requires a reliable estimate of how measurement errors change over time.
Our next questions concern the atmosphere itself. Does the pattern persist between rotations? Do different wavelengths change together? Longer monitoring and repeated visits can separate stable rotation from changing clouds and temperature. The β Pictoris b observations establish a basis for those tests.
The paper
Zhou et al. (2026). Photometric Variability and Rotation of β Pictoris b from JWST NIRCam Coronagraphic Imaging. The Astronomical Journal.